Monitoring, Tracing & Logging
The project uses Sentry (or a Sentry-compatible alternative like Bugsink) for error reporting, tracing, and structured logging. Everything is already configured and ready to use.
Why this matters
Section titled “Why this matters”Debugging in production can be painful. How many times have you been stuck in a situation where:
- The client / manager has a hard time giving you reproduction steps or context
- You can’t reproduce the issue locally
- You can’t access or find the right logs (because they’re in a container that gets erased after deployment)
Good monitoring tools can save you hours, days, or even weeks of debugging. Thanks to OpenTelemetry, they’re now easier to set up and use.
Why Sentry and OpenTelemetry
Section titled “Why Sentry and OpenTelemetry”Sentry is the de facto standard for error reporting with great UX and integrations with many frameworks. It can also be self-hosted. Plus, if you want to use an open source alternative, you can use Bugsink which is a Sentry-compatible alternative (without logging and tracing though).
OpenTelemetry has become the standard for logging and tracing. Sentry is compatible with it, and you can switch to alternatives like Signoz thanks to OTEL compatibility.
❓ How it works
Section titled “❓ How it works”The monitoring stack provides three main capabilities:
- Error Reporting: Automatic capture of unhandled exceptions with full stack traces and context****
- Distributed Tracing: Performance monitoring with OpenTelemetry, tracking request flows across your application
- Structured Logging: Pino logs are automatically sent to Sentry for centralized log management
Architecture Overview
Section titled “Architecture Overview”The monitoring system is initialized in apps/api/src/instrument.ts before the NestJS application starts. Under the hood, Sentry leverages OpenTelemetry to capture traces, its own SDK to track errors and Pino for logging.
We also use amplication/opentelemetry-nestjs to automatically trace controllers, services, database queries, etc. so we have complete traces.
Configuration Options
Section titled “Configuration Options”The Sentry initialization in instrument.ts provides several important options:
Sentry.init({  dsn: config.sentry.dsn,  environment: config.env,  release: config.version,
  // Capture 100% of traces - reduce in production!  // Setting this above 0 automatically enables OpenTelemetry tracing.  tracesSampleRate: 1.0,
  // Send default PII data (e.g., IP addresses)  sendDefaultPii: true,
  // Enable structured logging via Pino  enableLogs: true,  integrations: [Sentry.pinoIntegration()],
// Prevents Sentry from claiming global provider, allowing shared TracerProvider skipOpenTelemetrySetup: true,})📝 How to use
Section titled “📝 How to use”Since Sentry is already configured in the boilerplate, you only need to:
-
Set up your Sentry project
Section titled “Set up your Sentry project”Create a project in Sentry (or your self-hosted instance) and get your DSN.
-
Configure environment variables
Section titled “Configure environment variables”Add the following to your
apps/api/.envfile:SENTRY_DSN=https://<your-dsn>@sentry.io/<your-project> -
Start monitoring
Section titled “Start monitoring”That’s it! Errors, traces, and logs are automatically captured.
Viewing Errors
Section titled “Viewing Errors”Unhandled exceptions are automatically captured and sent to Sentry with:
- Full stack traces
- Request context (URL, headers, body)
- User information (if authenticated)
- Environment and release information
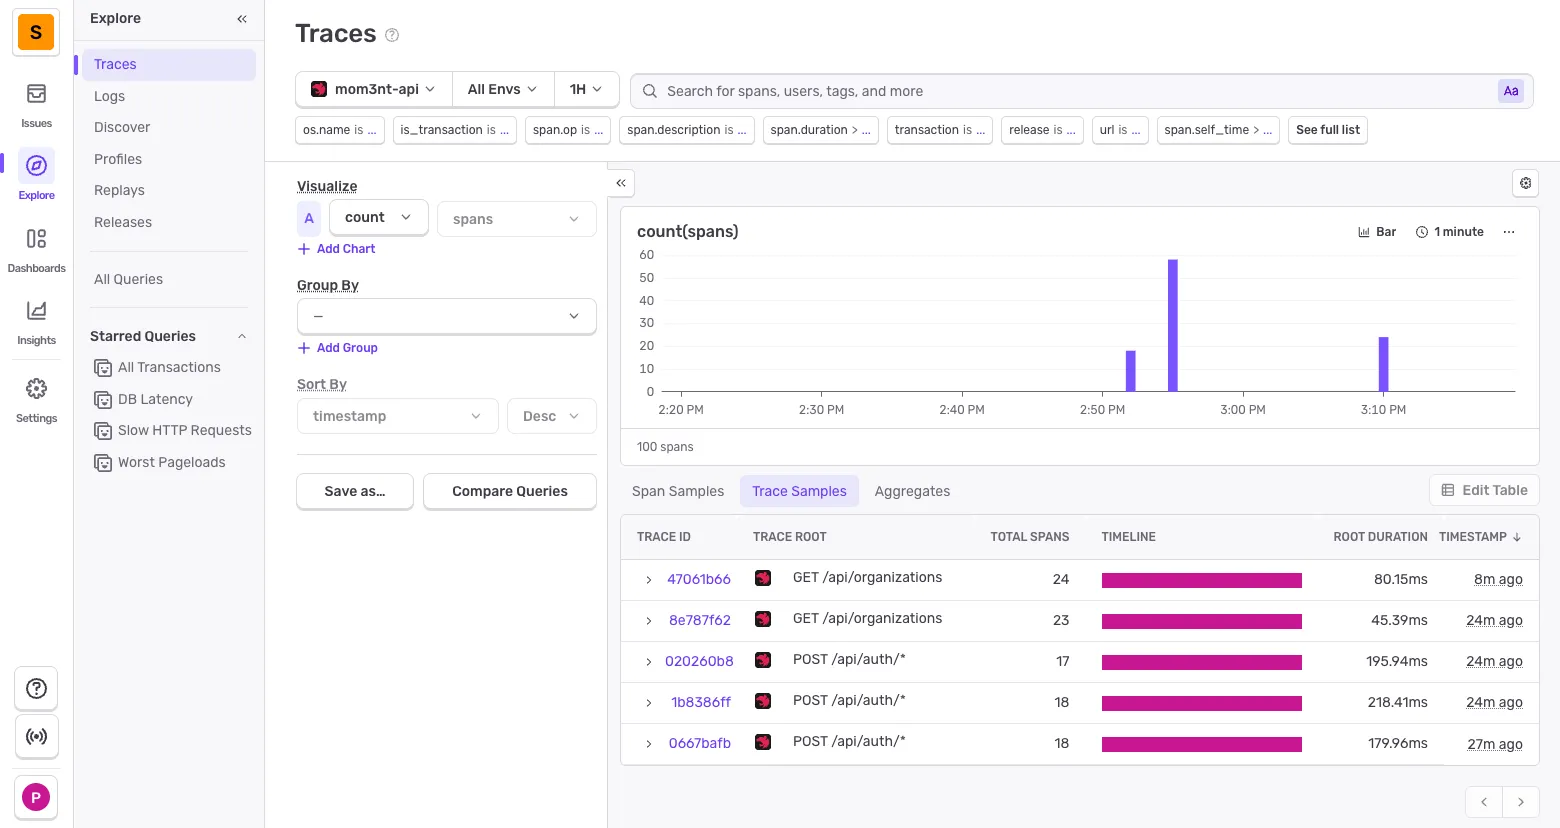
Viewing Traces
Section titled “Viewing Traces”Traces show the full request flow through your application:
Adding granular tracing
Section titled “Adding granular tracing”By default, OpenTelemetry doesn’t capture all method calls (only guards, controllers, DB queries, etc.). For more granular details, add the @Traceable() decorator at the class level:
import { Traceable } from '@amplication/opentelemetry-nestjs'
@Traceable()@Injectable()export class UserService {  constructor(private readonly userRepository: UserRepository) {}}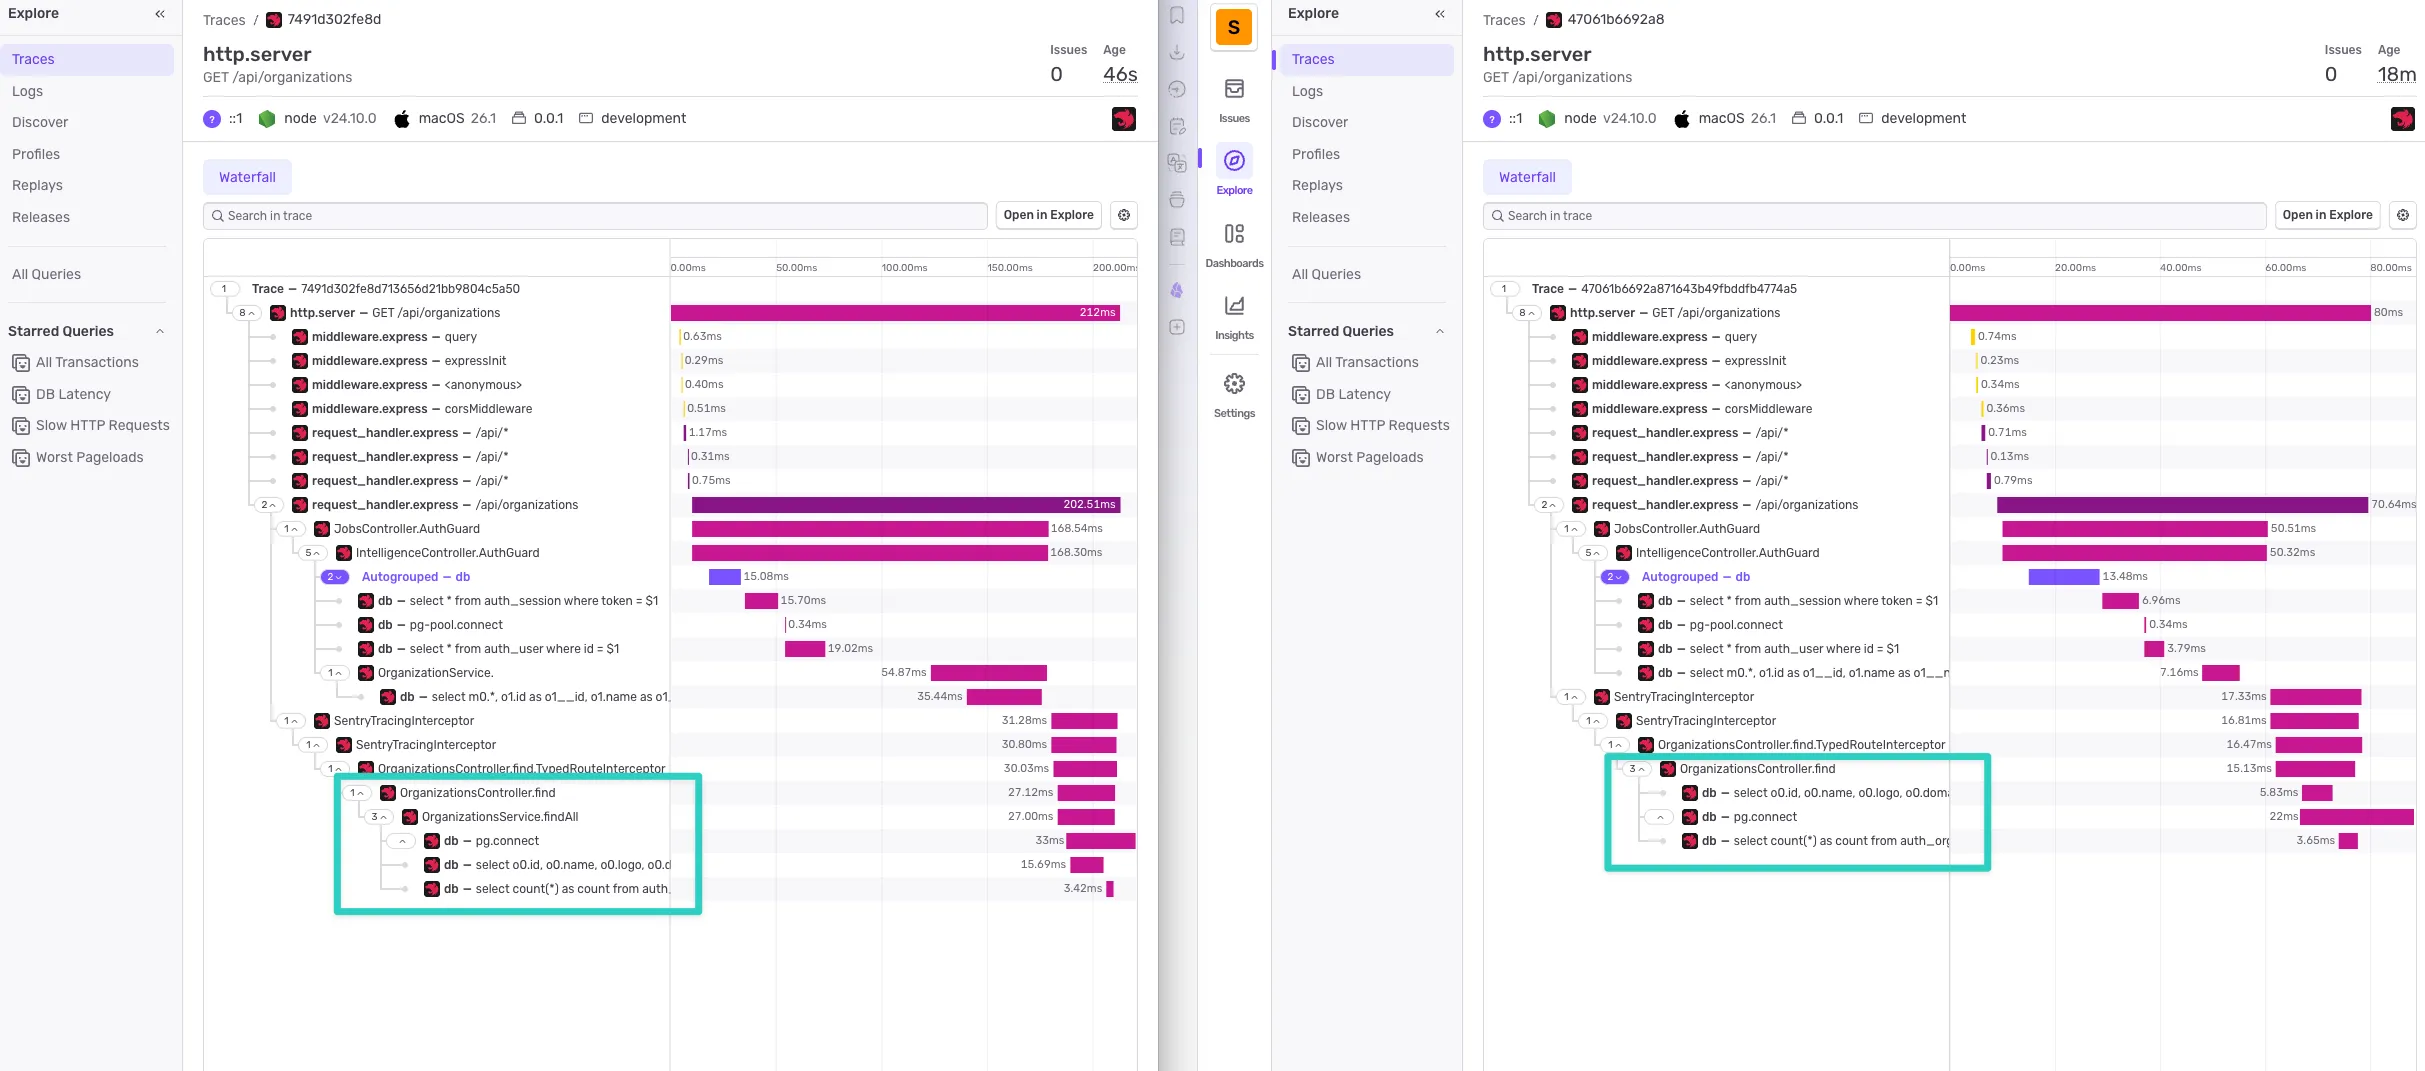
On the left, you can see the added granularity (service methods are now visible), which makes performance analysis much easier.
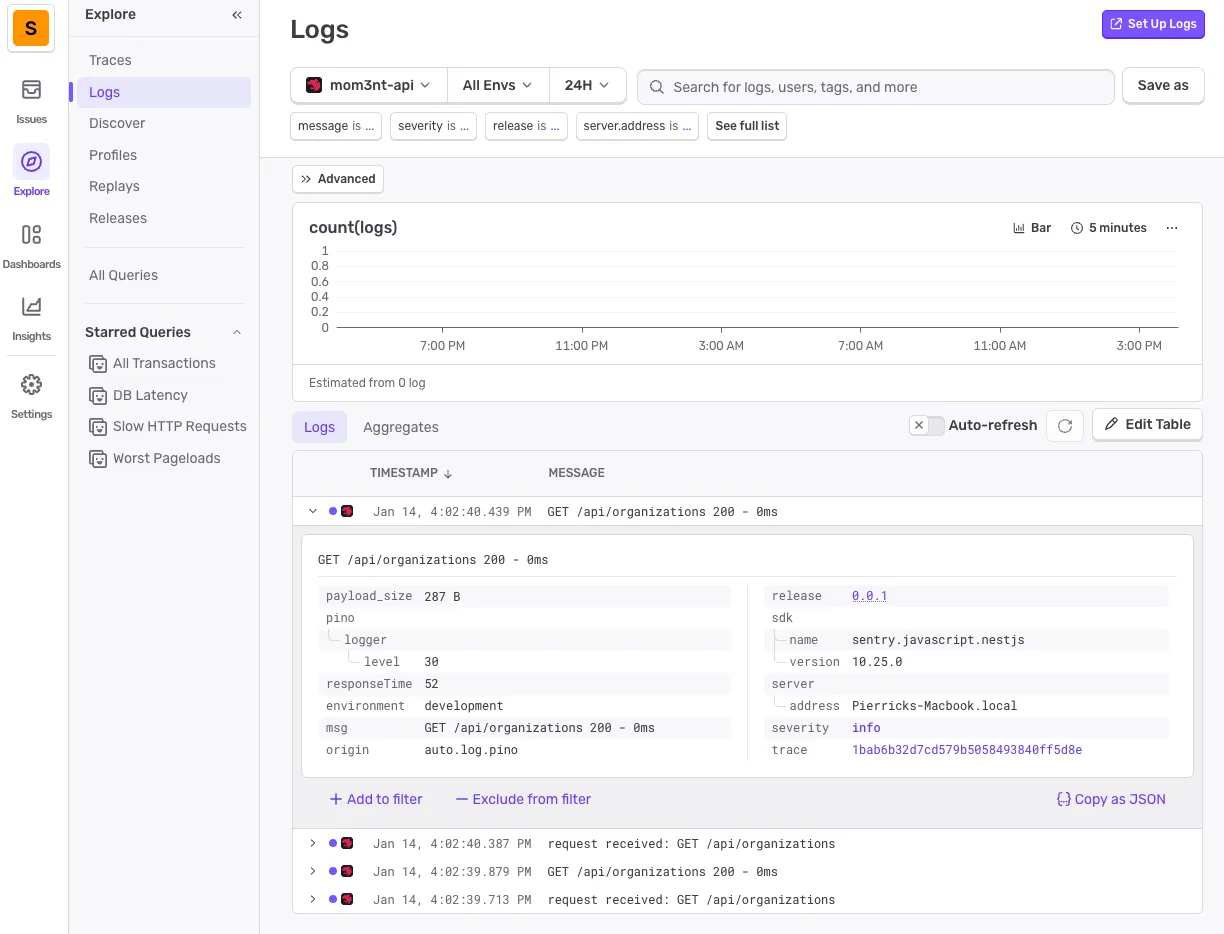
Viewing Logs
Section titled “Viewing Logs”Structured logs from Pino are automatically sent to Sentry:
🧹 How to remove
Section titled “🧹 How to remove”-
Remove the instrument file
Section titled “Remove the instrument file”Delete
apps/api/src/instrument.ts -
Update app.module.ts
Section titled “Update app.module.ts”Remove the Sentry and OpenTelemetry imports and configuration:
src/app.module.ts // Remove these importsimport { OpenTelemetryModule } from '@amplication/opentelemetry-nestjs'import { APP_FILTER } from '@nestjs/core'import { SentryGlobalFilter, SentryModule } from '@sentry/nestjs/setup'@Module({imports: [// Remove these two lines:OpenTelemetryModule.forRoot(),SentryModule.forRoot(),],providers: [// Remove this provider:{provide: APP_FILTER,useClass: SentryGlobalFilter,},],})export class AppModule {} -
Remove @Traceable decorators
Section titled “Remove @Traceable decorators”If you added
@Traceable()decorators to any services for granular tracing, remove them:// Remove @Traceable() and its importimport { Traceable } from '@amplication/opentelemetry-nestjs'@Traceable() // Remove this line@Injectable()export class YourService {} -
Remove dependencies
Section titled “Remove dependencies”Remove the following from
apps/api/package.json:"@amplication/opentelemetry-nestjs","@opentelemetry/sdk-trace-node","@sentry/nestjs","@sentry/opentelemetry",Then run
pnpm installto update the lockfile. -
Remove environment variables
Section titled “Remove environment variables”Remove from
apps/api/.envandapps/api/.env.example:SENTRY_DSN= -
Update env.config.ts
Section titled “Update env.config.ts”Remove the Sentry configuration from
apps/api/src/config/env.config.ts:// Remove from configValidationSchema:SENTRY_DSN: z.string().optional(),// Remove from config object:sentry: {dsn: configParsed.data.SENTRY_DSN,},